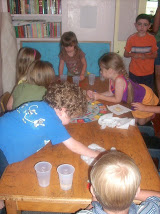
 The Jr. Robot Rampagers learned how to make some of the information that was collected into a better format so it would be easier to understand. They had monthly temperatures of the Great Basin in parts of Nevada, and they also had monthly amounts of precipitation in the same area. A graph of the amount of snowfall in the Great Basin was also made easier to understand. From that graph, the team noticed that about the same time they get their heaviest snowfall (about 4 inches max) we get ours, January.
 These easier to read formats will be posted on their posterboard.
Nice Work!!!


No comments:
Post a Comment